
Analysis of Utah Avalanche Fatalities in the Modern Era
The Utah Avalanche Center (UAC) has records of Utah avalanche fatalities for the modern era, totaling 114 deaths. The modern era refers to the post-mining decades (the late 1800s and early 1900s) and for this study, itbegins with an avalanche fatality near Alta, Utah on January 1, 1940. The primary aims of this study were to understand who was getting killed in avalanches, where they were getting killed, and what types of avalanches were killing them. By understanding these factors, and looking at trends over time, we might start to better understand how to forecast, educate, and otherwise influence the decision making of winter backcountry recreationists in Utah. As with any papers looking at statistics, it might be tempting to look at these fatalities as just numbers. But at the end of the day, each incident is not a number at all. Each incident is a human being, a person with a family and a community, with dreams and aspirations whose life was taken from them by an avalanche.
1. INTRODUCTION
Avalanches pose significant risk to the backcountry traveler in the winter environment and have been responsible for 114 recorded deaths since the winter of 1939/1940. The Forest Service Utah Avalanche Center was founded in the spring of 1980 and began issuing daily avalanche bulletins the winter of 1980/1981 in an effort to “keep people on top of the greatest snow on earth instead of buried beneath it.” The Utah Avalanche Center issues danger ratings with special emphasis on Avalanche Problems, their aspect, elevation, likelihood, size, and trend. By looking at the data to determine trends and patterns, we might gauge not only how well the Utah Avalanche Center has warned about the danger, but what improvements might be made in the future.
2. METHODS
Utah is located in the central Rocky Mountains of North America and is characterized by an intermountain snow climate and is known for abundant snowfall, moderate temperatures, and excellent winter backcountry recreation. Data used for this study was gathered via Snowy Torrents accident reports, the Center for Snow Science at Alta, and (often typed or hand-written) records maintained by the Utah Avalanche Center. Methods in gathering the data for the categories are as described below.
2.1 Danger Ratings
The earliest avalanche forecast centers, based in Seattle, Washington and Boulder Colorado began issuing danger ratings on a 4-point scale (Low, Moderate, High, Extreme). The term “Considerable” was added to the danger scale for the winter 1996/1997 in an effort to better describe what was then referred to as “Moderate to High danger”. In 2010/2011, the danger scale was amended to reflect travel recommendations as well as likelihood of triggering and expected size. Each avalanche center issues a single word Bottom Line to depict the overall danger for the day, however the Utah Avalanche Center (and others) have often spatially and temporally segregated the day’s danger, often with the use of “pockets” of the next higher danger rating. In this study, I “rounded up” pockets to the next higher danger level while defaulting to the highest danger rating on a day where the danger was segregated. For this study, I utilized the Bottom Line danger rating for the day and in some cases extrapolated a High danger rating for the day when an Avalanche Warning was issued. A few are Unknown. NR refers to No Rating. These include years prior to the creation of the Utah Avalanche Center in 80/81 or when a rating was not issued for that region or day.
2.2 Assigning Avalanche Problems
After the Utah Avalanche Center began issuing avalanche advisories with info-graphic – supported Avalanche Problems in 2005/2006, the format has been widely adopted around the world. Since then, the newly “coined” Avalanche Problems have become central to any discussion of the avalanche phenomenon among practitioners and educators. The Avalanche Problems have included location (aspect/elevation), likelihood of triggering, expected size, and forecasted trend. Following up on the UAC’s work, the Colorado Avalanche and Information Center published forecaster guidelines for assigning and grouping the avalanche problems. For a study looking at avalanche fatalities 1998/1999-2012/2013, the CAIC developed additional criteria to assign avalanche problems, and these criteria can be found in Appendix A. As avalanches were not formally described by Avalanche Problem prior to 2005, I combed through the reports to determine the failure plane, fracture line depth, and snowpack history and retro-actively assigned an Avalanche Problem name for each incident.
3. RESULTS
3.1 Fatalities by Year
With 114 fatalities since January 01, 1940, Utah averages 1.5 deaths/year. Utah averaged 2.1 deaths/year from 1985/1986-1994/1995; 4 deaths/year from 1995/1996-2004/2005; and 3.3 deaths/year from 2005/2006-2014/2015, with a 30 year running average of 3.13 deaths/year. While there have never been definitive studies that look at the growth of user days by backcountry recreationists, significant growth may be implied through backcountry gear sales numbers and personal observation.
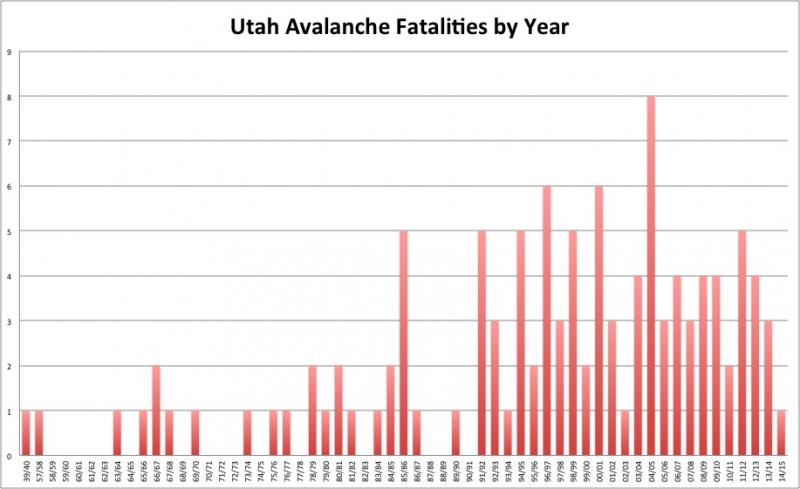
Figure 1.
3.2 Avalanche Fatalities by Region
Until the mid-1990s, the great majority of avalanche deaths occurred in the greater Wasatch range, as access and interest may have been greatest out of Salt Lake City, Park City, Ogden and Provo. There may also be some correlation with proximity to ski areas with 22 of the total 114 avalanche deaths stemming from access into either out of bounds terrain within or adjacent to the ski area. Figure 2 below gives an overall view of the proportion of avalanche fatalities by the seven regions as partitioned and forecasted for by the Utah Avalanche Center (Logan, Ogden, Salt Lake City, Provo, Uintas, Skyline, and La Sals). Figure 3 depicts trends over the last 30 years and clearly shows that the Uintas and Skyline areas have become regions of significant and growing avalanche activity. Table 1 below shows trends over the past three decades per region. Whereas the Uintas and the Skyline accounted for 0% of the fatalities from 1985/86-1994/1995, they accounted for nearly 30% of the fatalities from 1995/1996-2014/2015. Fatalities out of Ogden, Salt Lake, Park City, and Provo have accounted for just over 57% of the total over the same time period. While Logan accounts for only six fatalities, it’s worth noting that there the Logan forecaster continues to investigate increasing numbers of close calls and severe accidents just across the Idaho border in the Caribou-Targhee National Forest. The La Sals suffered an incident in the spring of 1992 that killed four people, including the avalanche forecaster for that region.
1986/86-1994/1995 1995/996-2004/05 2005/06-2014/15
Logan 1 3 2
Ogden 2 4 5
SLC/PC 12 18 10
Provo 2 5 2
Uintas 0 5 8
Skyline 0 5 5
La Sals 4 0 1
Table 1.
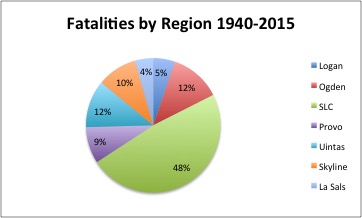
Figure 2.
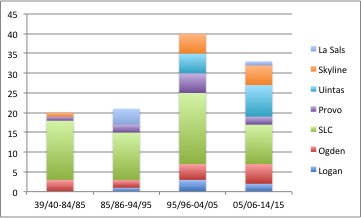
Figure 3.
3.3 Avalanche Fatalities by User Group
Figure 4 depicts the proportion of avalanche fatalities by user group (skier/snowboarder, snowshoer, snowmobiler, and other (camper, foot, climber, etc). With the lone exception of a snowboarder fatality in upper Big Cottonwood Canyon of the central Wasatch Range in February of 1986, all of the avalanche fatalities until 1994/1995 involved backcountry or “side-country” skiers or those on foot (hiker, etc). Figure 5 depicts the trends of user group fatalities from the past three decades as well as the winters spanning 1939/40-1984/85. Over the past twenty years, snowmobilers have overtaken skiers as the user group with the most fatalities. There is a strong correlation between user group and region and it should be noted that snowmobile use is prohibited in many parts of the Salt Lake City portions of the Wasatch due to water quality concerns. The mid 90s is when long tracks and mountain-specific sleds came out and there was a corresponding jump in snowmobile avalanche fatalities.
It should be noted again that 22 of the total 114 avalanche deaths stemmed from access into either out of bounds terrain within or adjacent to the ski area – and these data trends are noted in Figure 6. As almost 1 in 5 fatalities are from recreationists leaving the ski area to enter either closed terrain or out of bounds terrain (sometimes called “sidecountry” terrain), they may be of a different mind-set and experience than those that begin their outing from a trailhead. The data does not reflect in-bounds fatalities or pre-season fatalities prior to the resort being open for the winter.
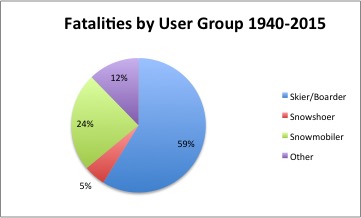
Figure 4.
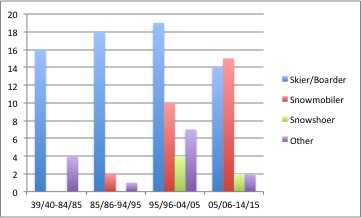
Figure 5.
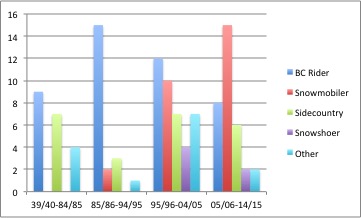
Figure 6.
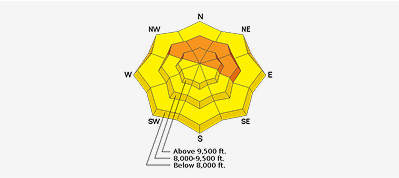
3.4 Avalanche Fatalities by Aspect
It did not come as a surprise that most fatalities occur on the northerly facing slopes. Northwest through north through northeast facing slopes held just over 75% of the fatalities while terrain above 9500’ (upper elevation band) accounted for more (54%) than the mid and low elevations combined. Snow quality is of the highest quality on these aspects and it’s no coincidence that ski resorts are built with this in mind. Aspect also plays a role in relation to sun and wind, which, in turn, plays a role in the type of Avalanche Problem one may encounter. Table 2, below illustrates the proportion of avalanche fatalities by aspect while Figure 7 does so in a graphical manner.
Aspect Number of Avalanche Fatalities
| North | 26 |
| Northeast | 42 |
| East | 11 |
| Southeast | 6 |
| South | 2 |
| Southwest | 3 |
| West | 4 |
| Northwest | 14 |
| Unknown | 6 |
| Table 2. |
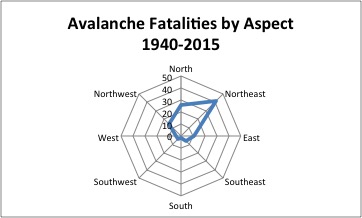
Figure 7.
3.5 Avalanche Fatalities by Elevation
While recreational elevations in the winter environment range from 4500’ in the foothills above towns and municipalities to over 13,500’ on King’s Peak in the Uinta’s, most backcountry winter recreation occurs between 8000’ and 11,000’. The Utah Avalanche Center issues danger ratings for separate elevation bands for the three bands noted below in Figure 8.
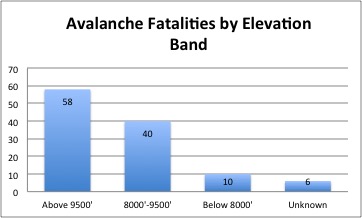
Figure 8.
3.6 Avalanche Fatalities by Danger
As the term Considerable was not added until the 96/97 winter, fatalities by danger rating for this study begin in that year. Utah has recorded 71 avalanche fatalities since then. Zero fatalities were recorded during Low or Extreme danger ratings, while Moderate, Considerable, and High account for 16%, 45%, and 38%, respectively, on days when a bottom line rating was provided. For 16 fatalities, no rating was given for the day (typically early season or on “off days” in the outlying areas). See Figure 9, below.
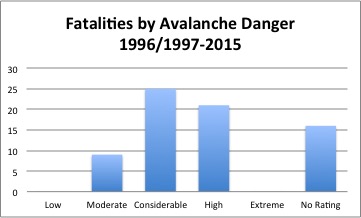
Figure 9
3.7 Avalanche Fatalities by Avalanche Problem
Beyond issuing an overall danger rating, the Utah Avalanche Center further details the expected Avalanche Problem(s) the winter backcountry user is expected to find. Each Avalanche Problem is then further described and rated for aspect and elevation, likelihood, size, and trend. One of the main goals of this study was to look at which Avalanche Problems contributed to more deaths than others. In other words, which Avalanche Problem(s) might be construed as “more lethal” than others. Surface hoar, faceted grains, and depth hoar played a role in most fatalities and this is best represented by the sheer numbers in the Persistent and Deep Slab categories. Figure 10 shows them in proportion to one another. Snow cascading off a roof in Midway, Utah in January 1995 comprises the lone roof-a-lanche in Utah. The two fatalities in Stairs Gulch of Big Cottonwood Canyon on April 28, 2001 may be the only reported glide avalanche deaths in the United States. Cornice fall resulted in the fatalities of six individuals. In each case, the weight of the victim(s) and cornice subsequently triggered another avalanche on the slope; however, for the purposes of this study, they were categorized as Cornice Fall.
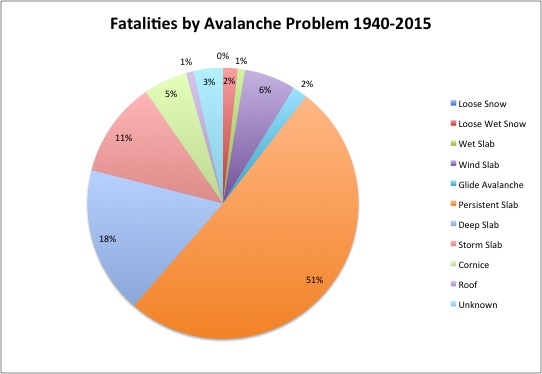
Figure 10.
3.8 Avalanche Fatalities by Danger Rating and Avalanche Problem
Human triggered avalanches on persistent weak layers may be triggered days, weeks, even months after they formed while the danger for triggering avalanches on non-persistent weak layers my diminish to zero over the matter of a few hours to a few days. As such, persistent weak layers (noted here by Persistent and Deep Slab avalanches) may carry a Moderate (L2) danger long after they have been buried and widely reactive. Part of this study was to look at the proportion of Avalanche Problems that resulted in fatalities per danger rating. For this analysis, I grouped Persistent and Deep Slab avalanches together in one group while putting everything else into the other group. For this study, I included Cornice Fall into the Other category regardless of subsequent avalanching. See Figure 11 below.
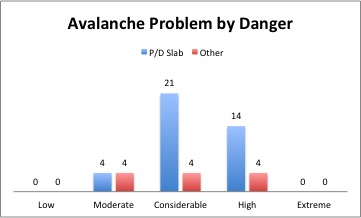
Figure 11.
CONCLUSIONS
In this study, I investigated the reported 114 avalanche fatalities in Utah for the modern era beginning in 1940; that is, fatalities in the post-industrial era and attributed to recreation in the winter environment. Not surprisingly, the Wasatch Front areas (Ogden, Salt Lake City, Park City, and Provo) make up 69% of the fatalities since 1940. Still, the trends are unmistakable, as one can clearly see a growing population recreating in the Uintas and the Skyline, terrain responsible for almost one-third of the fatalities over the past 30 years. While skiers and snowboarders comprise two-thirds of the fatalities since 1940, over the past 20 years alone, snowmobilers account for just over one-third of all avalanche related deaths. Nearly one in five fatalities involve people going into closed or out of bounds terrain from one of the mountain resorts.
In summary, while backcountry recreation continues its explosive growth in the Utah winter environment, it appears that the number of avalanche fatalities has plateaued over the past decade. While most fatalities involve backcountry skiers in the mountains east of the Wasatch front, the highest upward trends involve snowmobilers in the Uinta and Skyline areas. Continued outreach and education to these user groups in these areas – as well as improved teaching and forecasting for Persistent and Deep Slab avalanche problems may well reduce the numbers of accidents and fatalities in the coming years.
Appendix A: Avalanche Problems
Deep Persistent Slab (DS):
• Persistent weak layer of either faceted grains or depth hoar
• Average crown of 1.2 m (4 ft) or greater
• Destructive size of D3 or greater. Estimated destructive potential for broken trees gathered via reports.
Persistent Slab (PS):
• Persistent weak layer of surface hoar, faceted grains, or depth hoar, or bed surface
in old snow (O)
• Average crown of 4 feet (1.2m) or less
• Destructive size of 2 or 2.5. Estimated destructive potential for broken trees gathered via reports.
Storm Slab (SS):
• Bed surface in recent storm snow (S) or at the new/old snow interface (I)
• Accident investigator described Storm Slab
Wind Slab (WIND):
• Bed surface in recent storm snow (S) or at the new/old snow interface (I)
• Accident investigator described Wind Slab
• Photographs showed characteristic lens shape of Wind Slabs
Wet Loose (WL):
• Snow was moist or wet
• Did not release as a cohesive slab
Wet Slab (WET):
• Snow was moist or wet in the starting zone
• Released as cohesive slab
Glide (G):
• Released as wet, cohesive slab
• Released on the ground
Cornice Fall Avalanches (C):
• Failure of overhanging masses of snow
Roof (ROOF):
• Occurred on the roof of a structure
• Bed surface was the structure
Unknown (U) avalanches:
• Lack of data prevented us from coding into one of the above avalanche problems
Drew Hardesty
Utah Avalanche Center
Forecaster
Special Thanks to Greg Gagne, Andy Paradis, Spencer Logan, and the UAC staff