
Mark Staples
2015-2024 - Director, Forest Service Utah Avalanche Center
Weather and Snow Summary Fall 2022
To help understand the current avalanche situation, it helps to briefly review weather from this fall and its effect on the snowpack. This discussion focuses on the mountains of northern Utah. It is still relevant to other areas like the Skyline and La Sal mountains, but those places have had different weather patterns.
Here are the major weather events. Graphs (scroll to the bottom) from NRCS SNOTEL sites around the state show these precipitation patterns. There are also two graphs showing winds and temperatures.
- Dry and warm fall with no snowfall in the mountains
- First snowfall on October 23th
- Brief period of dry weather around Halloween
- Several storms in early November around the 2nd, 5th, and 8th
- No snow, cold temps and clear skies Nov 11th (Veteran’s day) to Nov 28th
- A very brief warm-up just after Thanksgiving
- Major snowfall Nov 29th
- Major windstorm with south winds Nov 30th to Dec 1st
- Major snowfall Dec 2nd
What were the effects of this weather?
Early snow was generally warm, wet, and dense which created a great base in many parts of the Wasatch Mountains that received the most snow. Certain parts of the Wasatch Range and other parts of Utah received considerably less snow. A brief period of high pressure around Halloween created some faceting in the snowpack. When snowfall returned on Nov 2nd, the danger spiked briefly with such a heavy load, but conditions quickly stabilized, and many places like the Central Wasatch had 3-4 feet of snow on the ground and great riding conditions.
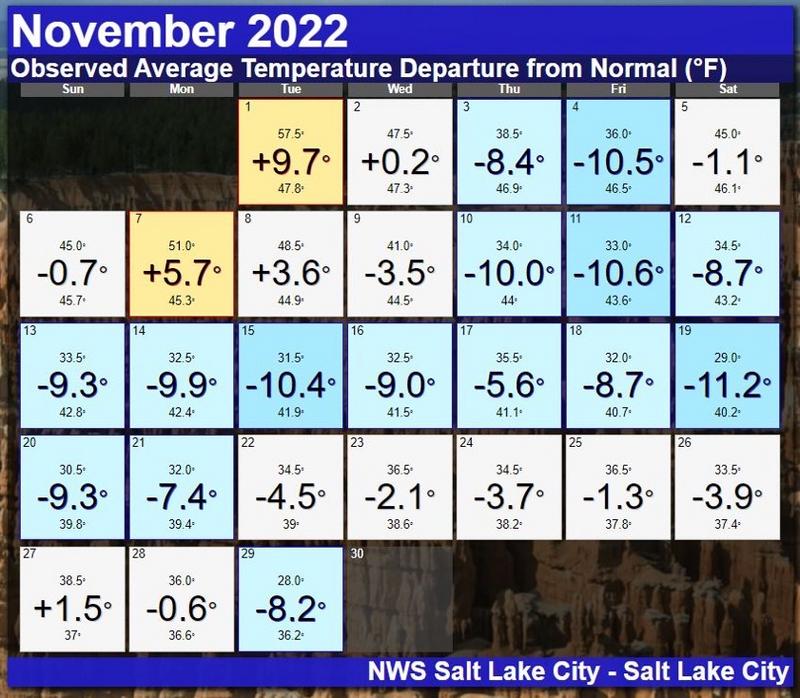
Precipitation stopped on Veteran’s Day (Nov 11th) and over two weeks of high pressure followed with very cold air temperatures and clear skies which made the snow colder than the air. On average, the snow was 16 degrees colder than air temperatures at night. There were many nights when air temps dropped into the single digits F, and the snow surface temp dropped to -10 degrees F. On average at night, snow surface temps were 16 degrees colder than air temps. This two-week period of very cold weather created a layer of very weak facets near the snow surface on all slopes.
Image below from the NWS Salt Lake City shows how average temperatures in November in SLC varied from normal temps.
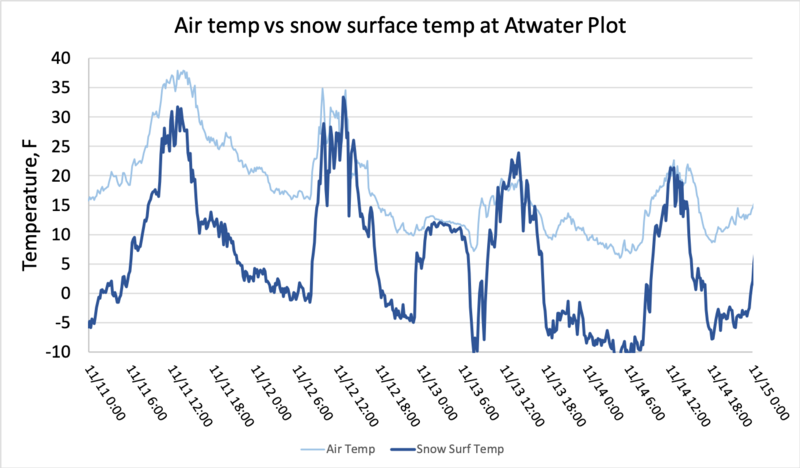
Graph below shows the difference between snow surface temperature and air temperature at the Atwater Plot in Little Cottonwood Canyon at 8750 ft.
Because the sun angle was so low (meaning the sunshine just isn’t very strong), south facing slopes developed a layer of faceted snow just like north facing slopes. There were only a few days of warm-ish weather (just after Thanksgiving) during this period when the snow surface became quite warm and damp. The end result was that ALL slopes had a layer of very weak facets. The difference was that some developed an ice crust on top fo the snow and shaded slopes did not. This ice crust was thick and strong on steep slopes facing due south. Any other slope receiving some sunshine (like southeast or southwest facing ones) developed a very thin and fragile ice crust.
Another storm on Nov 28th/29th delivered another heavy load of snow. Conditions were fairly uniform, and the only variability in the snowpack was total snow depth and the presence/thickness of ice crusts on top of the mid-November facets.
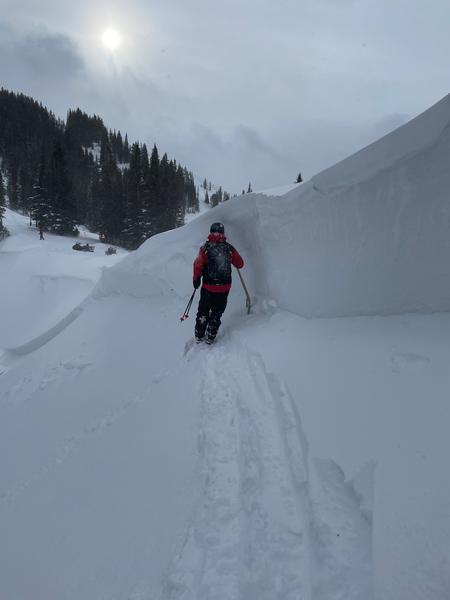
Then the south winds arrived and created highly variable snowpack conditions. There were two days of fierce winds from the south gusting 70-90 mph at 11,000 feet. Not only were these winds very strong, but a stable atmosphere at the time put a cap on the wind as they raked across the mountains. Often strong winds scour snow and send it pluming high into the sky. During this wind event, winds were squeezed between ridgelines below and stable air above creating perfect loading conditions. These winds curled over ridgelines and pushed the airborne snow down onto the leeward slopes. Winds also stripped away the Nov 28/29 snow on windward slopes, and in some cases, winds stripped away the underlying mid-November facets as well.
Graph below is of wind gusts on Hidden Peak in Little Cottonwood Canyon at 11,000 ft.
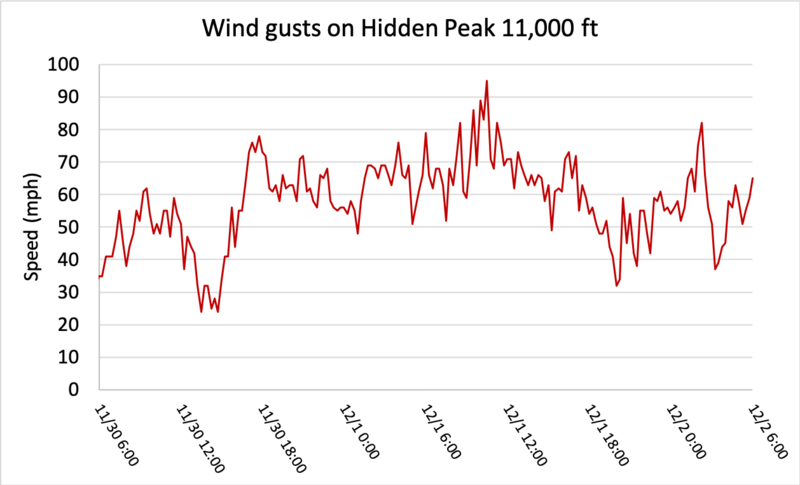
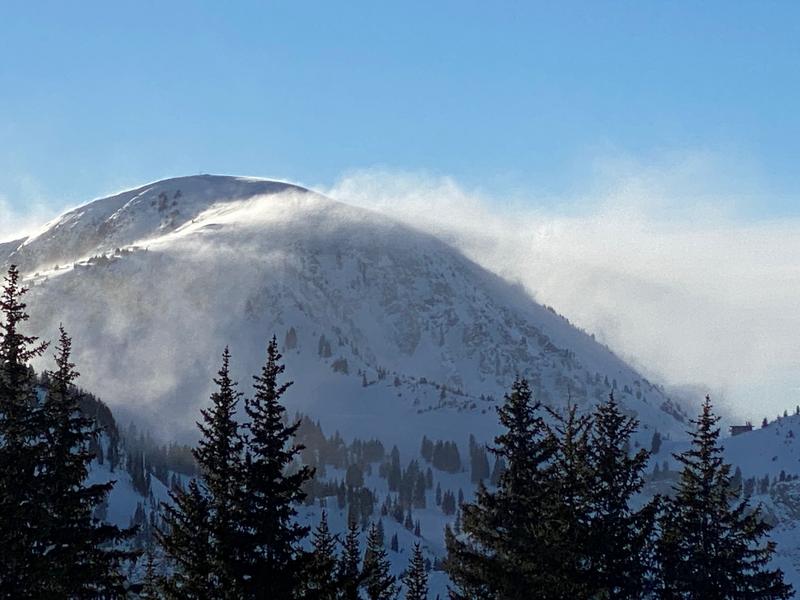
Photo of strong winds from the south transporting snow on Nov 30th in Little Cottonwood Canyon (E. Shmookler).
Where does all this weather leave us?
These winds formed thick (3-5 feet), very hard slabs of snow on many mid and upper elevation slopes. In most locations, these hard slabs are resting on the weak layer of facets from mid-November. Slopes that were sheltered from these strong winds have a soft layer of new snow on top of this weak layer. In many low elevations locations, this weak layer does not have enough snow on it to cause many avalanches - that time is still yet to come.
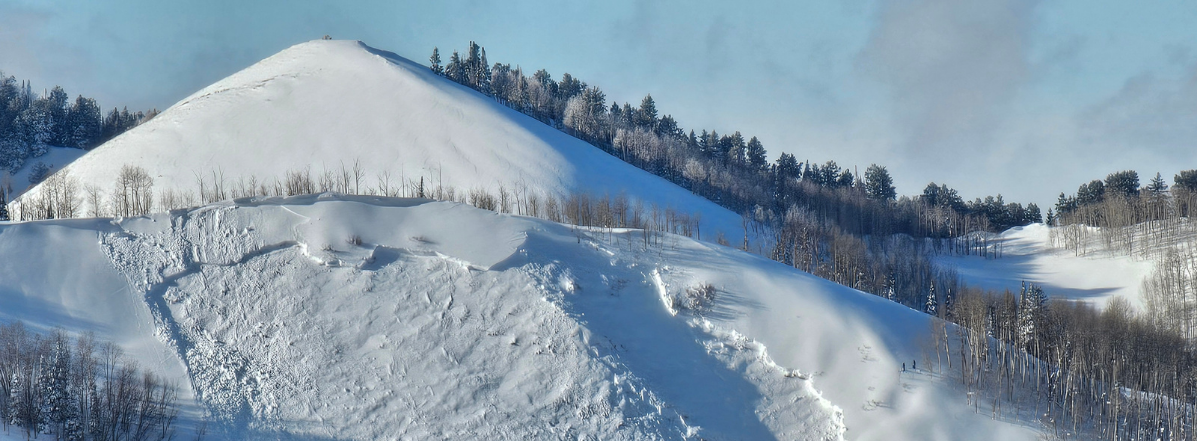
Photo shows an example of an avalanche involving one of these thick hard slabs formed by strong south winds on the Park City ridgeline. These hard slabs are resting on the weak layer of mid-November facets. (D. Kelly)
What about southerly facing slopes? The problem is that we often assume these slopes are safe because strong sunshine either prevents weak layer formation or destroys facets after they form. That is not the case this winter. Steep slopes facing due south have a thick ice crust that may require a lot of weight from a lot of snow to break it and cause an avalanche on the facets. Other southerly facing slopes have a fragile ice crust that may require just a little more weight before avalanches break on the facets, but not much extra weight. Complicating the situation is that the strong winds scoured some southerly facing slopes so much that they removed the facets. Bottom line - southerly facing slopes have a complex and variable mix of layering. Don’t assume southerly facing slopes are free of faceted layers.
What about slopes with a thick, hard slab from the Nov 30th/Dec 1st winds? These slopes have already produced some large, deadly avalanches. Snow safety teams at ski areas have triggered some and been surprised by some as well. Having a very thick, hard layer of snow on top of a layer of facets is one of the trickiest and most dangerous avalanche situations to deal with. These hard slabs are hard to trigger, which makes them tricky because their stability is hard to assess. They can also surprise us because sometimes many people can ride on these slabs before they avalanche. If you do trigger one, they are deadly and destructive. Often places to trigger these hard slabs are places where the slab is a little thinner and softer, but those spots are invisible.
What’s the best way forward? What happens next? As of Dec 4th, it appears that the general weather pattern will continue to bring more snowfall. The best mindset and approach to riding in the backcountry will be to “step back”. Ride low angle slopes and avoid avalanche terrain for now because the uncertainty is too high. Karl Birkeland often says “the line is blurry, and the more time you spend near the line, the more likely you are to end up on the wrong side of it.” Right now the line is especially blurry.
Will the weak layer of facets from mid-November heal? Eventually, yes. More snow is the solution, but it’s a double-edged sword. More snow means more weight which means more stress on the weak layer. More snow will make conditions more unstable and make avalanches larger. Things will have to get more dangerous before they can get better. When enough snow falls, this layer will be insulated and buried deeply enough that it can either become dormant or totally heal. Sometimes layers like this can come to life again and produce more avalanches with a big enough load of new snow. Be patient. There are many great powder days ahead. Don’t take chances in avalanche terrain now and risk missing out on those great days to come.
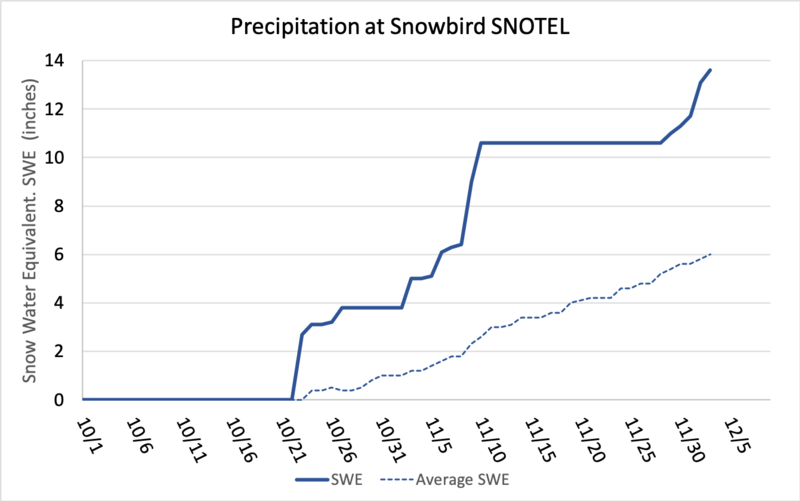
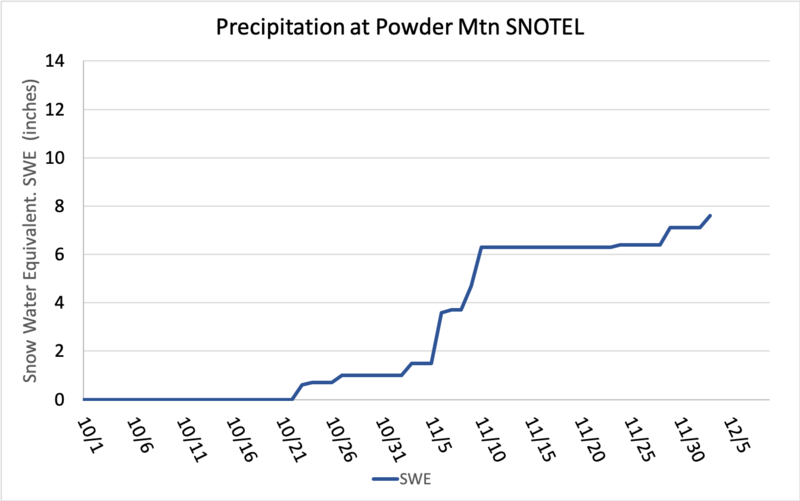
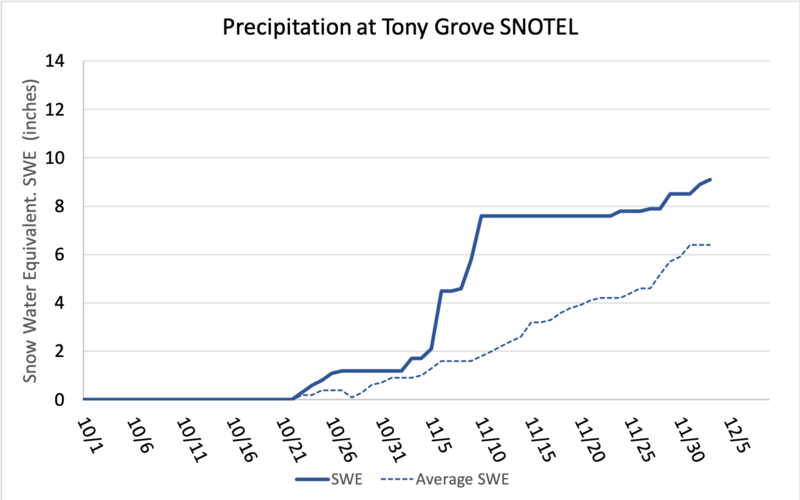
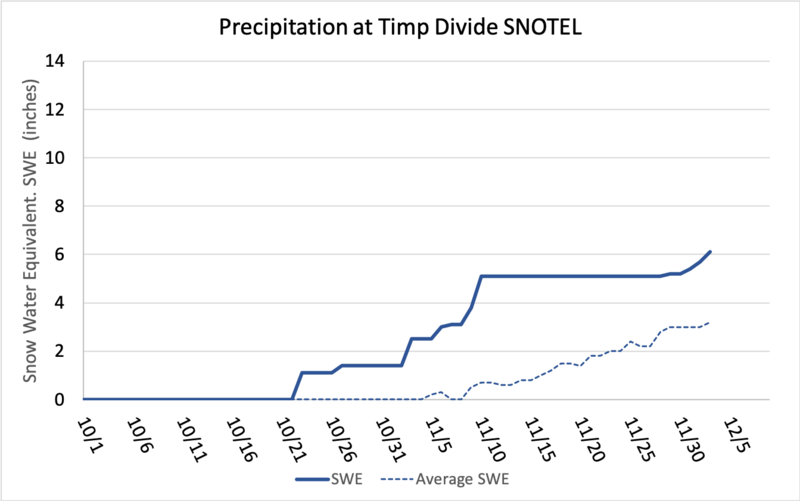
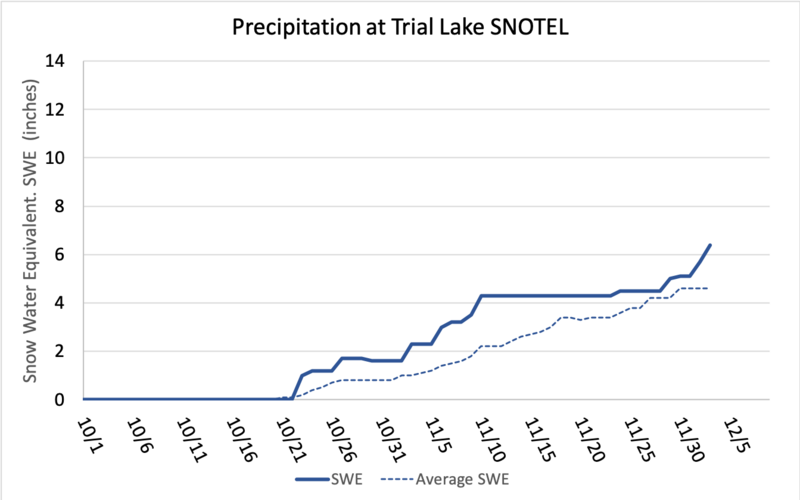
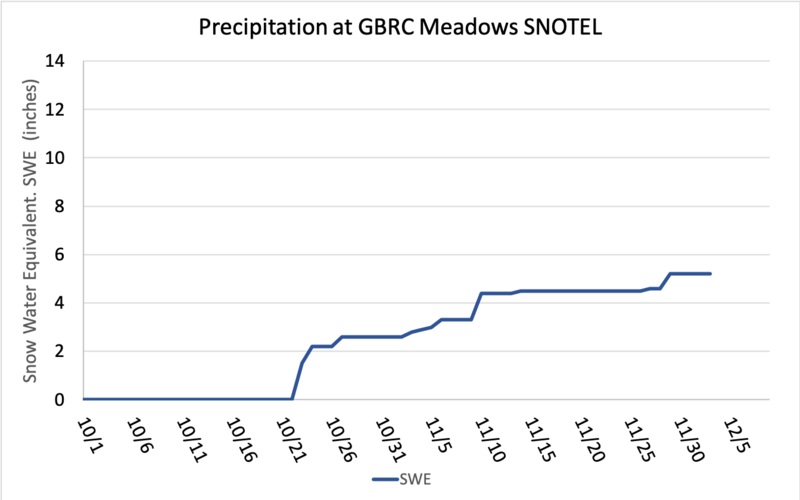
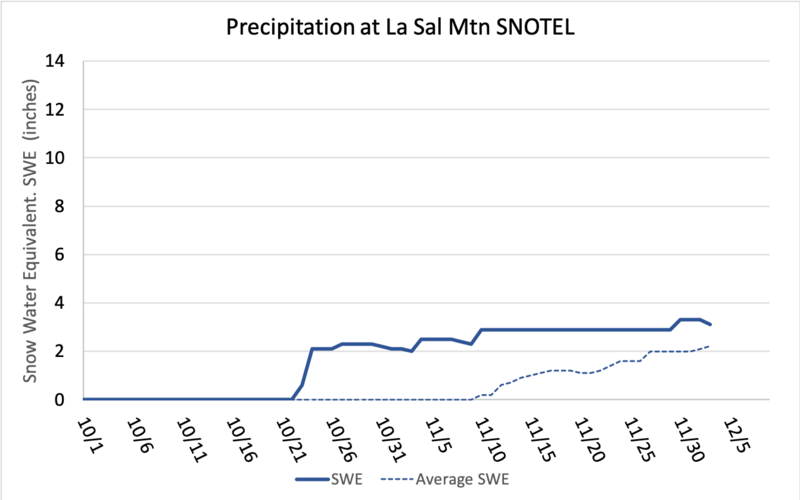
How to read the graphs below: The precip graphs come from NRCS SNOTEL sites that measure the water content of the snow. When the line goes up, it’s snowing. The higher the line goes up, the bigger the storm. A general rule of thumb is that 1 inch of water is a foot of snow. When the line is flat, it is not snowing and often weak layers of facets are forming.
Note on precip graphs: the dashed lines are the average precip from the last 30 years. (Actually they are the median values of precip, but you can think of it as the average). A few SNOTEL sites are new and do not have a 30 year record.
Precip graph from the Snowbird SNOTEL site at 9,177 ft representative of the SLC area mountains.
Precip graph from Powder Mtn SNOTEL site at 8,505 ft representative of the Ogden area mountains.
Precip graph from Tony Grove SNOTEL site at 8,474 ft representative of the Logan area mountains.
Precip graph from Timp Divide SNOTEL site at 8,140 ft representative of the Provo area mountains. This site shows the general precip patterns but less precip than other areas.
Precip graph from Trial Lake SNOTEL site at 9,992 ft representative of the Uinta mountains.
The following two graphs come from SNOTEL sites in the Skyline and La Sal Mountains. These areas have had different weather patterns than northern Utah; however, they have been included here as a matter of record.
Precip graph from GBRC Meadows SNOTEL site at 9,858 ft representative of the Skyline mountains in central Utah.
Precip graph from La Sal Mountain SNOTEL site at 9,578 ft representative of the La Sal mountains near Moab.
Thank you
Nicely summarized
Geoff Turner (not verified)
Thu, 12/8/2022
- reply
Thanks so much for taking the time! This was a wonderful read!!
Dave Case (not verified)
Thu, 12/8/2022