With a snow pack largely consisting of facets and depth hoar, I recently spent some time as a fledgling student in the Brett Kobernik Garage Science School of Snow monitoring temperature gradients and near-surface faceting. On December 7,8 the Wasatch received 30-45 cms of snow (it is sometimes hard to believe it in fact snowed this season), followed by a week of very cold high pressure. On December 9, I deployed thermocrons for measuring the temperature of the snow surface, as well as 2 cms down from the surface, with the intention of recording the temperature gradient in the top few cms of snow. Temperature gradients are largely responsible for creating faceted snow, and it is often most pronounced right near the surface producing the aptly-named "near-surface facets." The first image shows the temperature of the snow surface (in green) and the temperature of the snow 2 cms below the surface (in red.) It is quite easy to see the wide swings from day to night, as well as the gradient between the two measurements.

The following image illustrates the actual gradient in blue (normalized to C/m). As you can see, the gradient is quite steep, at one point on 12/9 reaching 175 C/m. For much of the week, the gradient spent much of its time north of 100 C/m. In avalanche education we are told the critical gradient for faceting to occur is 10 C/m (or 1C over 10 cm.) However, when temperatures are colder, a steeper gradient is required. Following a discussion with Brett Kobernik, Tom Kimbrough, and Wendy Wagner, I tried to develop a model that illustrated the required gradient based on a mean snow temperature using some curve fitting. (This attempts to approximate what is really occurring - namely, a vapor transfer. However I haven't yet taken Brett's class on measuring vapor pressure gradients.) This image additionally includes a green line that represents my model for the required minimum gradient based on mean snow temperature. (There are so many other factors at work - pore space, grain size, grain shape, to name a few - that this does not address.) This graph shows that with the exception of early afternoon on 12/9, the recorded gradient was well above the minimum required gradient.

The following images are the faceted crystals taken on 12/12 and 12/13. (It is easy to see why faceted grains are also called "squares".)
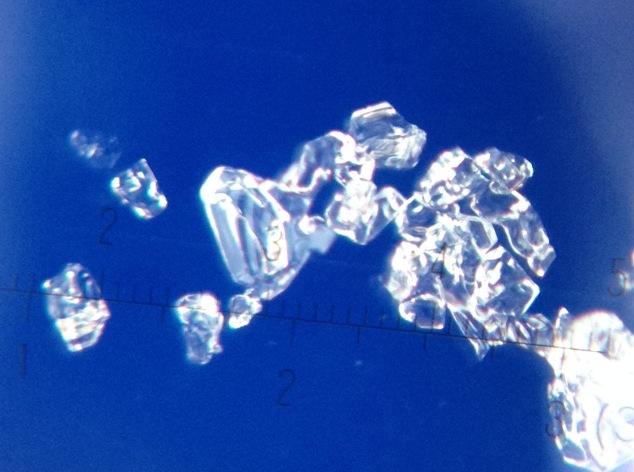
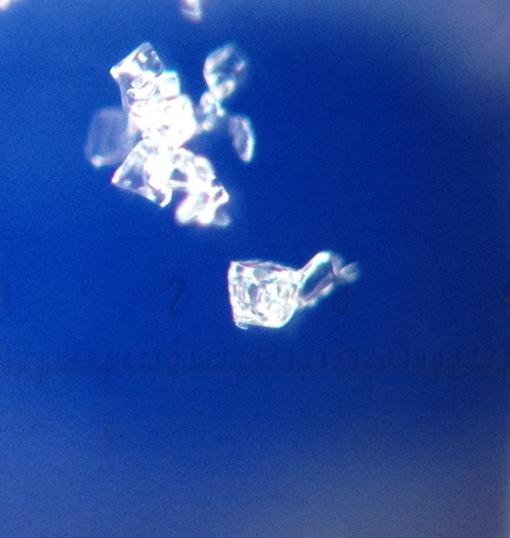
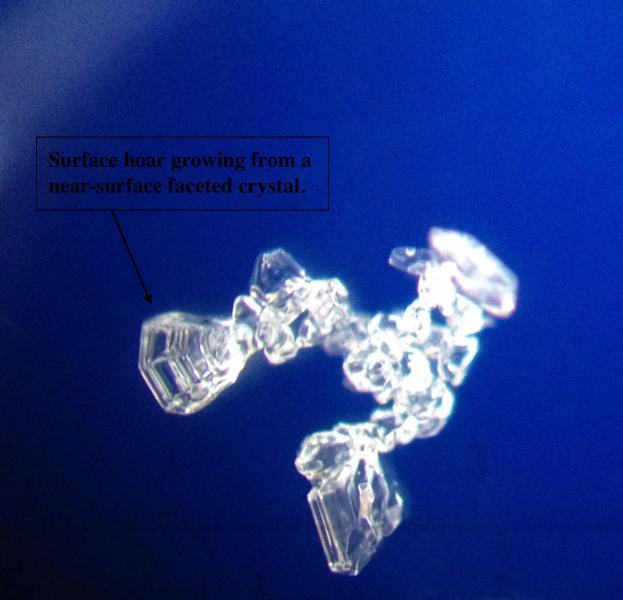
The first two photos were taken on 12/11 when cold, dry conditions dominated. This is the type of weather conditions suitable for rapid development of faceted crystals. What is interesting about the following photo is that it shows surface hoar growing on a near-surface faceted crystal. This last photo was taken on 12/13, after a few days of increasing relative humidity which provided a better environment for surface hoar development.
