Getting the data
Configuring your software
You will need to configure the User Agent string in your script/application. If you're using "off-the-shelf" tools like wget, curl or standard libraries for PHP, Python, Perl, etc. you may find your queries are being blocked or return a 400 HTTP status code. We recommend setting your User Agent string to something logical that includes a contact email address, a URL back to your site, and/or a product identifier.Please keep the number of queries to a sane amount. Forecasts are generally issued daily between 5 and 8 AM. It's extremely rare for a forecast to be updated after it's been published. This means you don't need to hit the JSON endpoint every 5 seconds. Instead, we recommend every 15 minutes between 5 and 8 AM or until the forecast has been issued for that day.
Making sense of the data
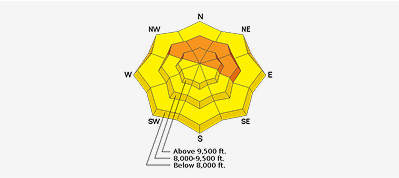
The output is an array of all forecast fields including danger roses. While most field values should be obvious, decoding the values for the danger rose requires a brief explanation.Each element of the rose array corresponds to a position on the rose, starting from the highest elevation, northern aspect and proceeds clockwise. The first position of the array, array[0] is the inner-most (highest) elevation segment on the N aspect. The next position, array[1] is NE and so on. Ex. the position for S aspect at the lowest elevation is array[20].
The value of each element corresponds to the danger rating scale.- 0 = No rating
- 1 = Pockets of low danger
- 2 = Low danger
- 3 = Pockets of moderate danger
- 4 = Moderate danger
- 5 = Pockets of considerable danger
- 6 = Considerable danger
- 7 = Pockets of high danger
- 8 = High danger
- 9 = Pockets of extreme danger
- 10 = Extreme danger
To further illustrate the danger rose and values, use the following danger rose and corresponding 'overall_danger_rose' array as an example.


