When forecasting for any avalanche, probably the most important relationship is strength vs. stress. In other words the strength of the weak layer compared to the amount of weight added on top of that weak layer. Witha depth hoar snowpack, thin snow is weak snow. So when a storm approaches, I like to make a mental map of snow depth. If the storm adds the same amount of weight on all slopes, then the thin areas should slide first. But storms seldom load all slopes uniformly, so you have to do a little simple math. Like I say it's the relationship that's important--strength vs. stress.
One simple calculation to approximate strength vs. stress during a stormisthe percentage increase in total snow water equivalent. I like to think of itlike a stack of gymnastsstanding on each others' shoulders. If you start with only one gymnast and add another on his shoulders, you have doubled the weight his feethave to support (a 100% increase). On the other hand, if you start with a stack of twogymnasts and add a third, you have only added a third more weight onto the feetof the lowest gymnast (a 50% increase).
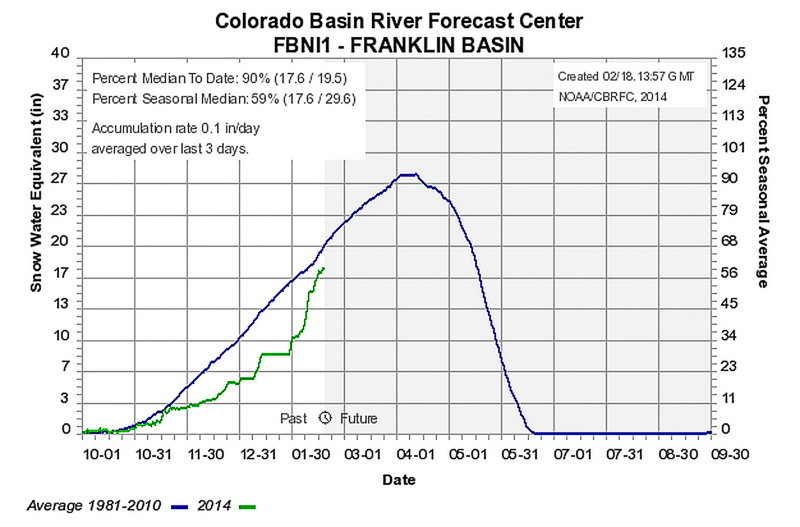
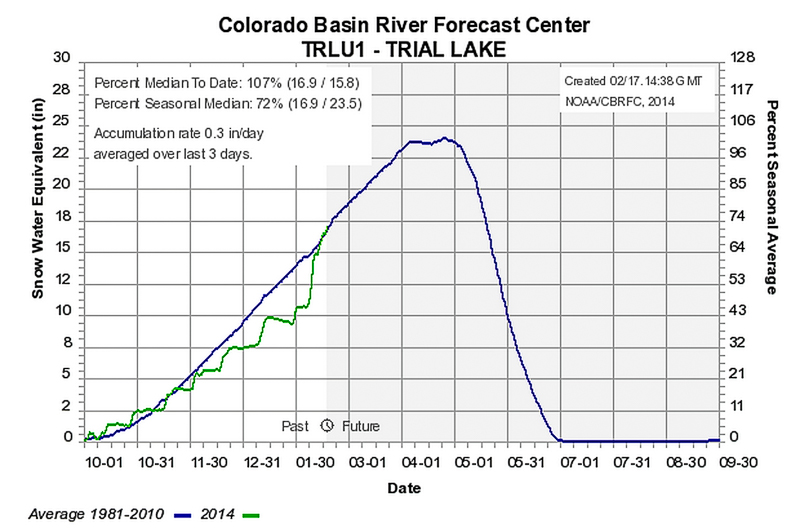
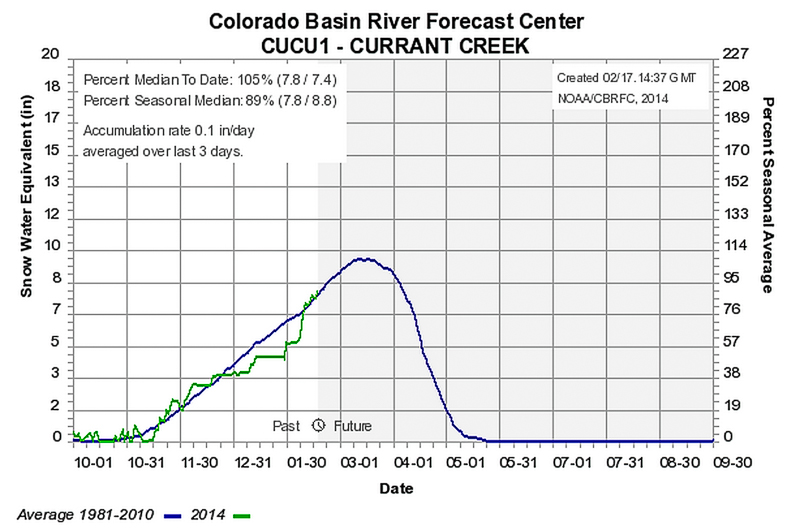
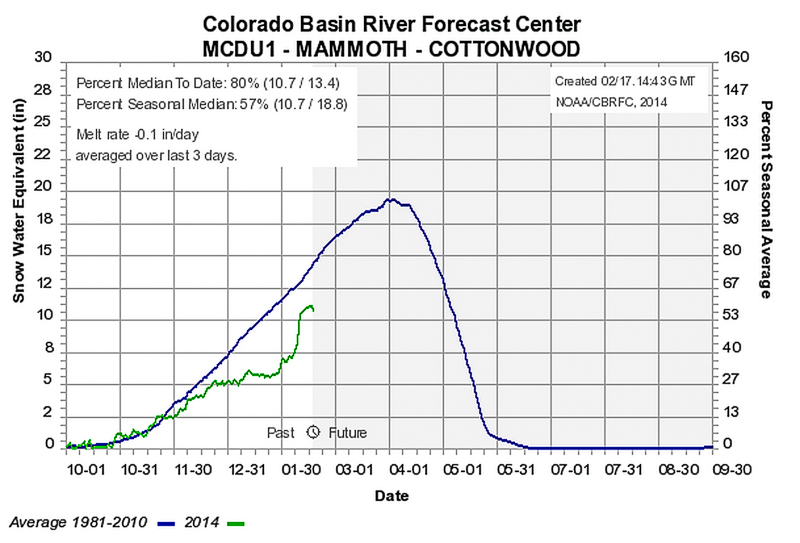
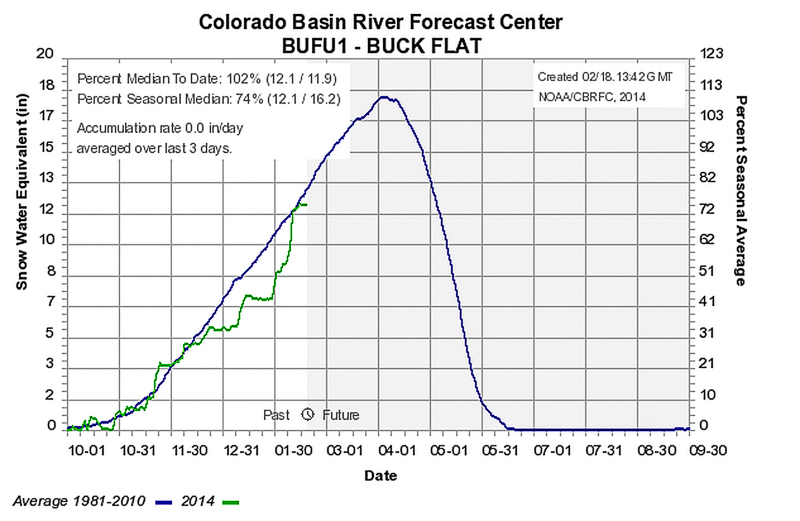
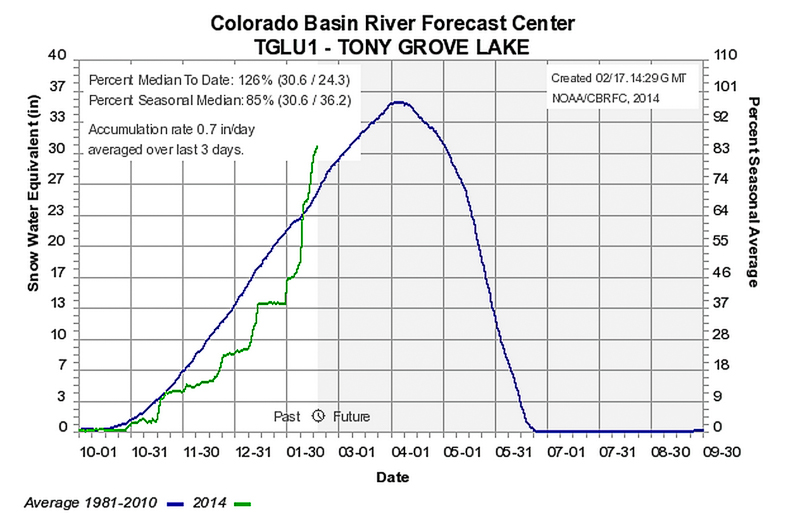
Here, I have created a table with the numbers for various SNOTEL sites in various regions and I also added the seasonal graphs of each ones as well, so you can see graphically how significant this extended storm has been. Looking at the numbers, it's no wonder why the Logan area mountains have gone through such a huge avalanche cycle where there was a whopping 125% increase in snow water equivalent since the storm started. In other words, more precipitation fell in the past threeweeks in the Logan area mountains than has fallen during the first three months of winter. Amazing. (The graph above is from Tony Grove Lake in the Logan area mountains.)
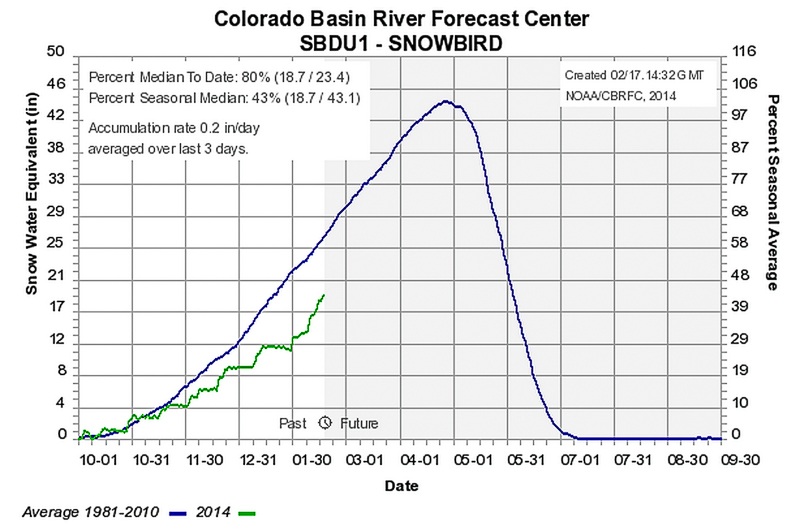
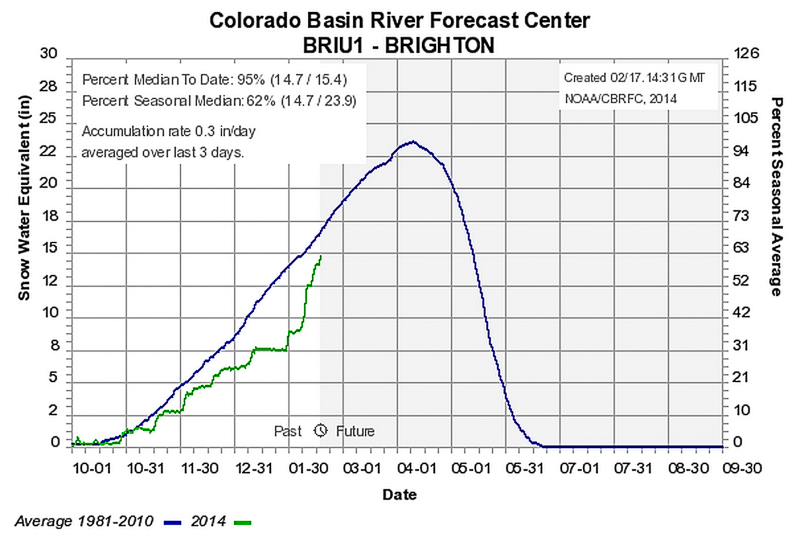
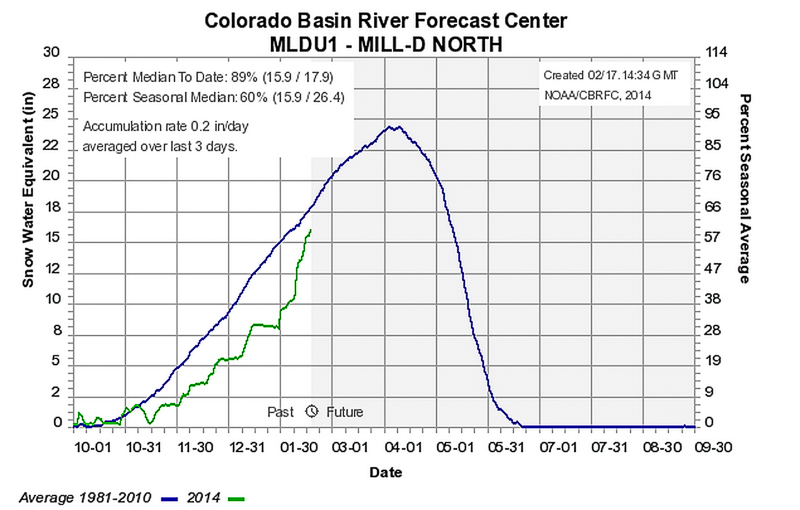
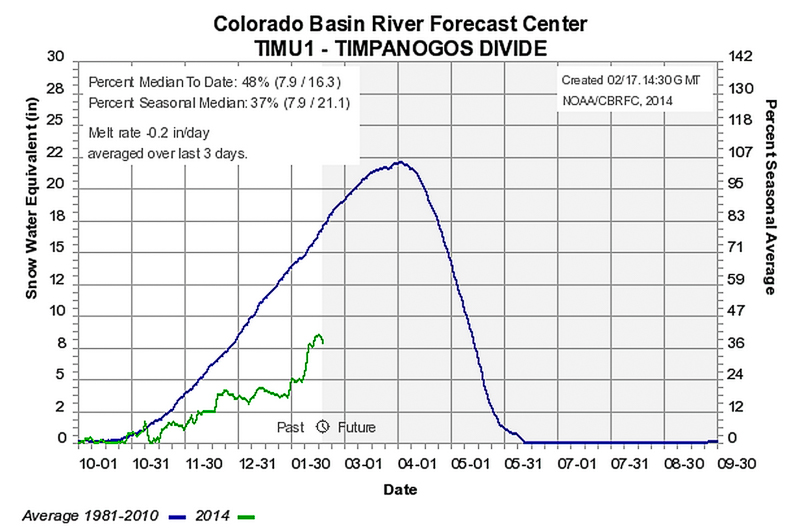
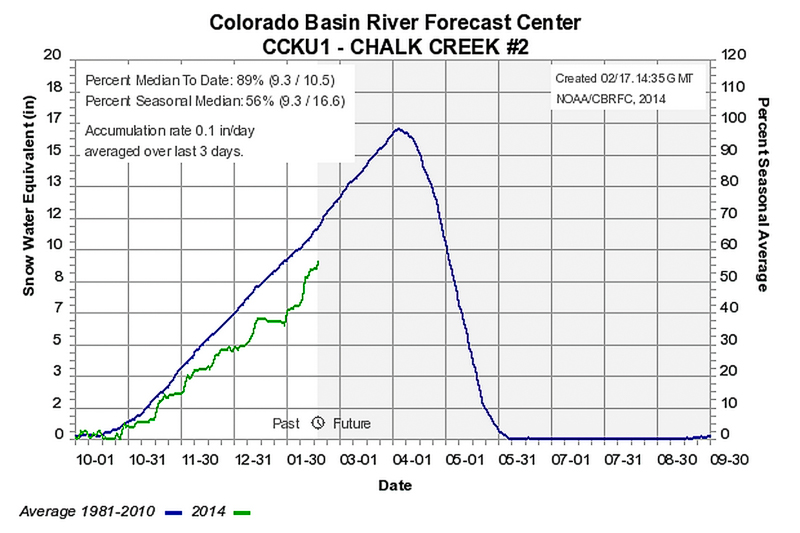
The other regions have lower numbers--generally 70-100%. But we have to remember that the Salt Lake area mountains--especially the Cottonwood Canyons--had a bit thicker, stronger, pre-existing snow than the other regions when the storm began, which is probably why it experienced perhaps the least amount of avalanche activity of any of the northern and central Utah regions. The UintaMountains, especially, had the weakest snow seen in years before the start of the storm. Plus, wind was seemingly invented in the Uintas where the snow often resembles a pane of glass on top of a pile of tortilla chips. Craig Gordon, the Uinta forecaster, felt that the SNOTEL sites were under representing the amount of snow falling during the last storm, probably because of the high wind. So they not only got more snow than indicated, but the wind tends to drift the snow onto the starting zones. So the Uinta numbers may not be as representative as other regions. The Uintas went through one of the most significant avalanche cycles in years and large, natural avalanches continue to release there. You could probably also make that assumption for the very windy Manti Skyline. Finally,remember that lower elevation areas had a thinner, weaker, pre-existing snowpack than higher elevation stations. Things get complicated fast.
Anyway, since we lack the funding to do more sophisticated snowpack modeling, I keep coming back to this simple calculation as a quick-and-dirty approximation. Any way you calculate it, this was a whopper of a storm.
The storm started near the end of January and ended February 16.
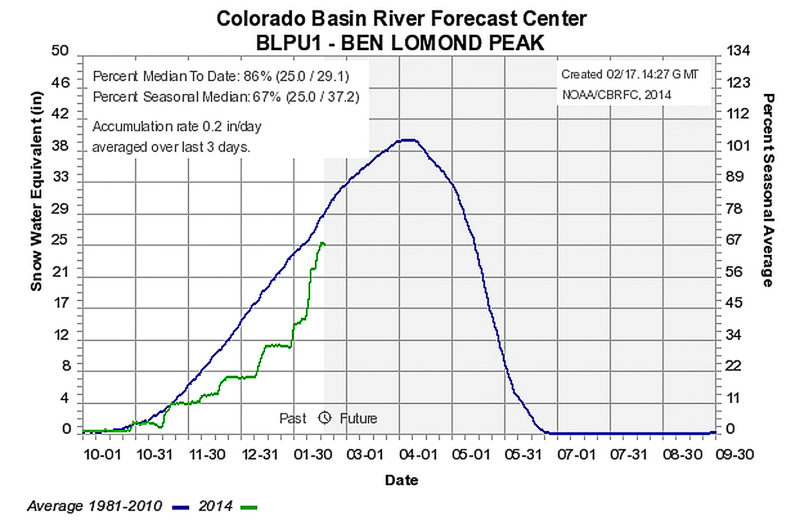
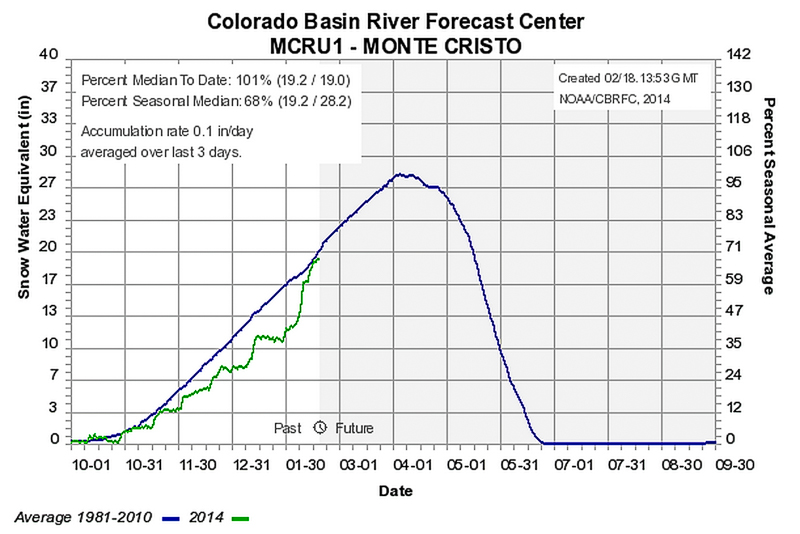
SNOTEL Station % Change in Total Snow Water Equivalent Logan Tony Grove 125% Franklin Basin 125% Ogden Ben Lomond Peak 116% Monte Cristo 73% Salt Lake Snowbird 73% Brighton 88% Mill D North 100% Provo Timpanogos Divide 100% Cascade Mountain 67% Uinta Chalk Creek 50% Trial Lake 89% Current Creek 73% Manti Skyline Mammoth Cottonwood 83% Buck Flat 79% Huntington Horse 64% GBRC Meadow 74% GBRC HQ 70%Here are the rest of the individual graphs: